Debugging with erl_crash.dump: A Practical Example from the Field

When working with Elixir releases in Docker, even small misconfigurations can cause crashes. Recently, I encountered an issue that perfectly illustrates how the erl_crash.dump can help pinpoint the problem. Here’s what happened:
The Scenario
I was testing a build locally using an Elixir release packaged into a Docker image. When I ran the container, the application crashed with a typical error message that like this:
Runtime terminating during boot (terminating)

Crash dump is being written to: erl_crash.dump...done
(Your message may vary, but you’ll usually see a log indicating that the crash dump was created and that an application terminated unexpectedly.)
Investigating the Crash Dump
Step 1: Opening the Crash Dump
On my local file system, I opened the erl_crash.dump file using the built-in Erlang tool:
:crashdump_viewer.start.
This tool provides a convenient interface for navigating through the dump file without having to manually sift through a massive text file.
Step 2: Navigating to the application_controller Process
Within the crash dump viewer, I went to the Processes tab and selected the application_controller process.
But why is the application_controller a good place to start?
- Central Role: The
application_controlleris responsible for starting and supervising applications. Any misconfiguration or error during startup often gets reflected here. - Early Indicator: Since the crash occurred during application boot-up, examining the
application_controllerprocess often gives you insight into what failed to start correctly. - Stack Trace Clarity: The stack trace associated with this process typically contains detailed information on the initialization flow, helping to pinpoint the misbehaving component.
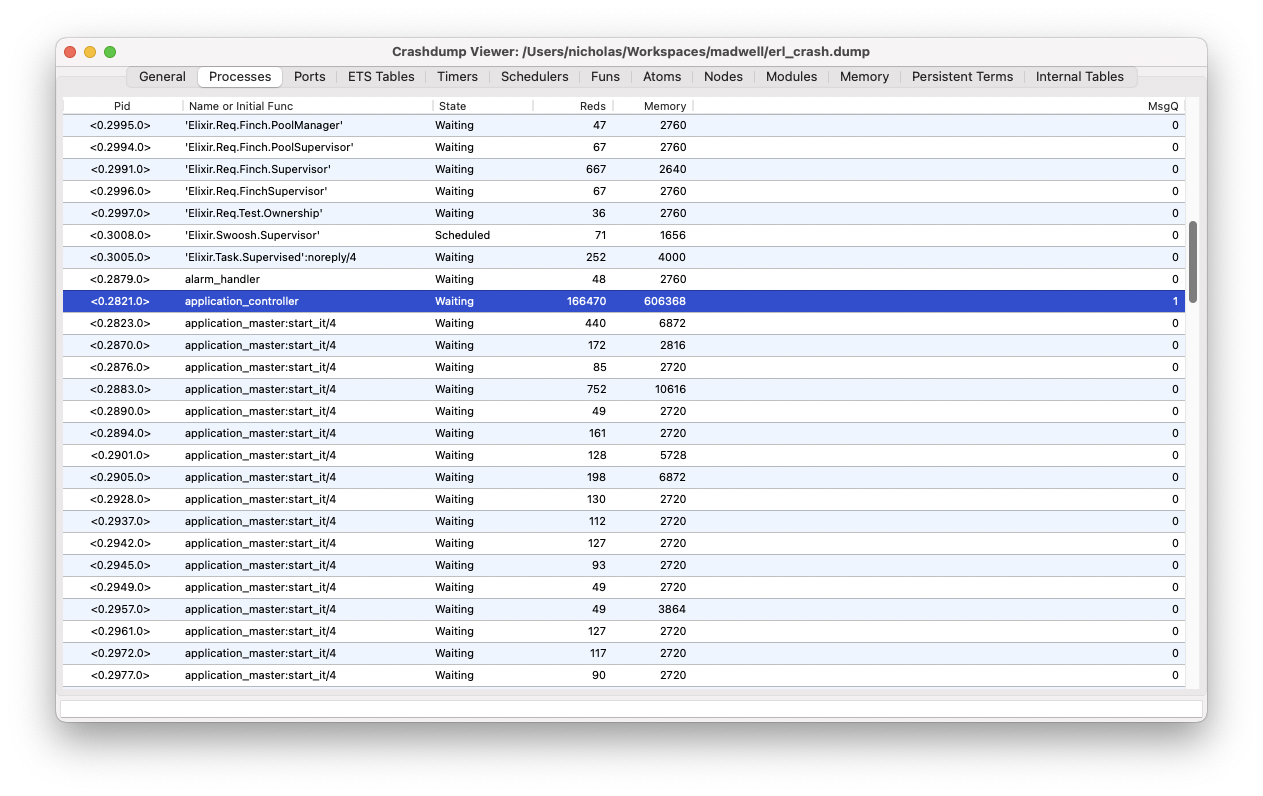
Step 3: Examining the Stack Trace
After selecting the application_controller process, I examined its stack trace.
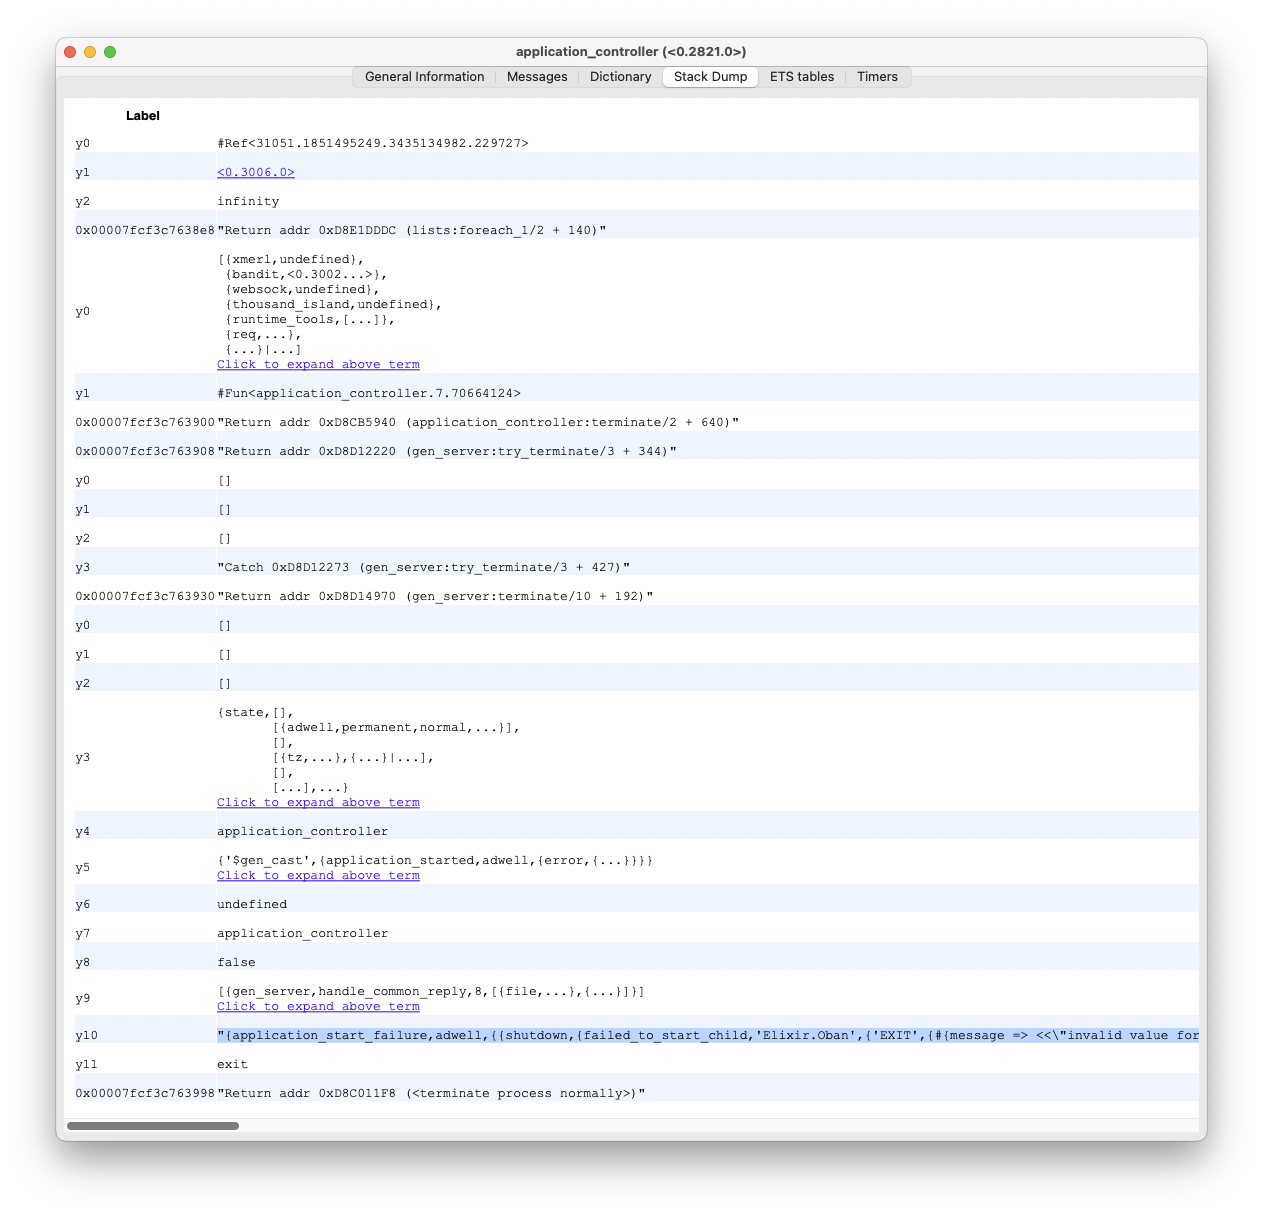
This is where the clue emerged. The stack trace included the following message:
"{application_start_failure,adwell,{{shutdown,{failed_to_start_child,'Elixir.Oban',{'EXIT',{#{message => <<\"invalid value for :plugins, invalid value for :crontab, MyApp.InvalidWorker not found or can't be loaded\">>,'__struct__' => 'Elixir.ArgumentError','__exception__' => true},[{'Elixir.Oban.Config',new,1,[{file,\"lib/oban/config.ex\"},{line,99}]},{'Elixir.Oban',start_link,1,[{file,\"lib/oban.ex\"},{line,464}]},{supervisor,do_start_child_i,3,[{file,\"supervisor.erl\"},{line,959}]},{supervisor,do_start_child,3,[{file,\"supervisor.erl\"},{line,945}]},{supervisor,'-start_children/2-fun-0-',3,[{file,\"supervisor.erl\"},{line,929}]},{supervisor,children_map,4,[{file,\"supervisor.erl\"},{line,1820}]},{supervisor,init_children,2,[{file,\"supervisor.erl\"},{line,889}]},{gen_server,init_it,2,[{file,\"gen_server.erl\"},{line,2229}]}]}}}},{'Elixir.Adwell.Application',start,[normal,[]]}}}"
This error message was immediately revealing: it indicated that there was an invalid value provided for the :crontab option in the plugins configuration for Oban:
invalid value for :plugins, invalid value for :crontab, MyApp.InvalidWorker not found or can't be loaded
Step 4: Identifying the Root Cause
From the error message, it became clear that I had mistakenly referenced the wrong module name for a cron-based Oban job. Instead of using the correct module name, I had a typo or misnamed module (MyApp.InvalidJob), causing the configuration to fail during startup.
The Takeaway
By following a systematic approach with the erl_crash.dump:
- Opening the dump file with the built-in viewer.
- Starting with the
application_controllerprocess to get a clear view of application initialization. - Examining the stack trace for meaningful error messages.
I was able to quickly identify that the root cause was a misconfigured module name in the Oban job’s configuration.